FORMATSMLBPublished 4 min read
OBP Instead of Average: One Category, a Different League
We score on-base percentage instead of batting average, and that one column rewrites the hitter pool.
Last reviewed
Our league plays 5×5 roto with one deliberate distortion: on-base percentage replaces batting average. The scoring line reads HR/RBI/Runs/SB/OBP for hitters, Wins/K/Saves/ERA/WHIP for pitchers. Same ten categories, same names on the jerseys. But the arithmetic of that single swap re-sorts every hitter who steps to the plate.

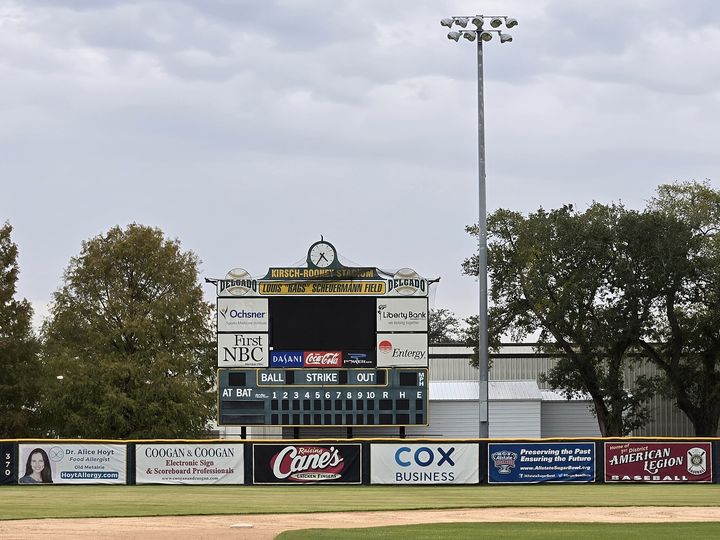
Photo: Tdorante10, CC BY-SA 4.0 · source file

The Category, as Our Rules State It
The league's published rules document is unambiguous. Hitters compete in five categories: home runs, runs batted in, runs scored, stolen bases, and on-base percentage. Pitchers chase wins, strikeouts, saves, earned run average, and WHIP. The champion receives 14 points at season's end; last place receives 1. Nothing in that structure hints at the quiet violence of the OBP substitution.
Batting average has been the familiar denominator of hitter value for generations of fantasy players. Our board removed it. In its place sits a formula that reaches into the same plate appearances and counts something different. The roster spot that once belonged to a.280 hitter who never walked may now belong to a.250 hitter who reaches base another way. The same five hitting categories, re-weighted by one changed denominator.
How this league scores
- NFL
- normal head-to-head format, normal NFL scoring rules re: yards, 4 points for TD pass, 6 for TD run or catch, etc. Straight wins and losses per week. 13 weeks of regular season, then 3 weeks of playoffs (6 teams), same as regular NFL fantasy leagues (Week 17 doesn’t count). NOT PPR
- MLB
- 5 x 5 roto, except OBP instead of AVG. So HR/RBI/Runs/SB/OBP, plus Wins/K/Saves/ERA/WHIP
- NBA
- normal 8-category roto: points, rebs, assists, steals, blocks, threes, FT%, FG%
Source: the league rules document. Quoted as written — nothing is paraphrased and nothing is added.
What the Two Formulas Count
Batting average is spare: hits divided by at-bats. Sacrifice flies do not exist in its world. Walks do not exist. Hit-by-pitch does not exist. The formula looks only at times the batter tried to get a hit and succeeded.
On-base percentage expands the frame. The numerator adds walks and hit-by-pitch to hits. The denominator adds walks, hit-by-pitch, and sacrifice flies to at-bats. Every way a batter avoids making an out enters the calculation.
The difference is not philosophical. It is arithmetic, visible on any scorecard. A player who walks 100 times in a season adds 100 to an OBP numerator that batting average never sees. Those same walks also inflate the OBP denominator, but the effect is not neutral: a walk improves OBP more than it dilutes it, because the walk itself is a successful plate appearance. A sacrifice fly, meanwhile, hurts OBP by adding to the denominator without adding to the numerator—a pure out, in this accounting, where batting average simply looked away.
What That Does to a Hitter's Value
The re-ranking is mechanical. A hitter who walks in 15 percent of his plate appearances gains ground against one who walks in five percent, even if their batting averages sit identical. The gap compounds across a full roster: 162 games of walks accumulate in the standings while batting average ignores them entirely.
Power hitters who walk intentionally gain no special advantage here—those walks are already counted in both formulas. The real beneficiaries are the grinders: leadoff types who work deep counts, aging sluggers whose bats have slowed but whose eyes have not, catchers and middle infielders whose defensive value keeps them in lineups despite eroding contact skills. Their OBP may trail their batting average by only fifty points rather than the hundred-point gap that separates the two for free-swingers. In our ledger, that compresses their distance from the top of the category.
The losers are equally predictable. Contact hitters who expand the zone, who punish mistakes but chase marginal pitches, who sacrifice selectivity for the occasional extra-base hit—they bleed value in the conversion. A.290 batting average that rests on aggressive early-count swinging may translate to a.320 OBP that drags rather than lifts. The same player, the same production in four shared categories, sinks in the fifth.
What It Does to a Draft
Rankings built for batting average cannot survive the transplant. A draft sheet that sorts hitters by composite value under AVG/OBP assumptions will misplace dozens of players when only OBP governs. The misplacement is not marginal: it is systematic, concentrated at positions where plate discipline varies most widely.
First base and corner outfield, where power and patience historically cluster, compress toward the mean. Shortstop and catcher, where weak-hitting regulars often survive on defensive merit, separate into two populations: those who walk enough to stay afloat and those who become category anchors. The middle tiers of the draft, where most leagues spend their auction dollars or early-round picks, become a swamp of misidentified value. A player projected for $18 in batting-average leagues may clear $25 here, or fall to $12, based on a single column in the projection spreadsheet.
The adjustment is not merely additive. It is reconstructive. A roster construction that balanced power and speed under batting-average assumptions may find itself overweight in runs scored and light in RBI, because the high-OBP hitters who replaced low-walk alternatives tend to bat higher in the order. The category swap cascades.
Why One Category Is Enough to Change a League
One of ten. That is the ratio. Our rules changed one formula and left nine untouched, yet the standings at year's end will show a different champion than batting-average leagues would have produced. The effect is not theoretical: it is scored in our ledger, point by point, as the 14-point champion separates from the 1-point cellar.
The walk is the event that makes this so. Batting average discards it. On-base percentage builds a category around it. Every leadoff walk that advances no runner, every eight-pitch at-bat that ends in a free pass, every bruised elbow that sends a hitter to first base—these moments accumulate across six months and 2,300 team plate appearances into a standings column that rewards patience and punishes aggression. The hitter who masters that single skill, who treats the walk not as consolation but as production, climbs the pool without changing anything else he does.
More in Formats
 302Multi-Sport Fantasy Leagues, ExplainedWe run one competition across three sports, so here is how the format works before you argue about the scoring.
 303Roto and Head-to-Head in the Same LeagueWe score weekly wins and season-long tallies in the same league, and the two systems do not measure the same thing.
 2
2