DRAFTSPublished 5 min read
Building a Draft Board When the Sports Do Not Match
We build one board for three sports, and the hard part is comparing players who never meet.
Last reviewed
Three scoring systems, 49 roster slots, one draft order. That is the arithmetic every manager faces when a single league runs football, baseball and basketball simultaneously. No statistic converts a quarterback's passing yards into a shortstop's on-base percentage. The categories do not match, the formats diverge, and any attempt to rank a wide receiver against a power forward collapses into guesswork. Yet drafts proceed, picks get made, and champions emerge. The mechanism that makes this possible is not player comparison but slot scarcity: each sport occupies a fixed share of the roster, and each share carries a fixed maximum payout.

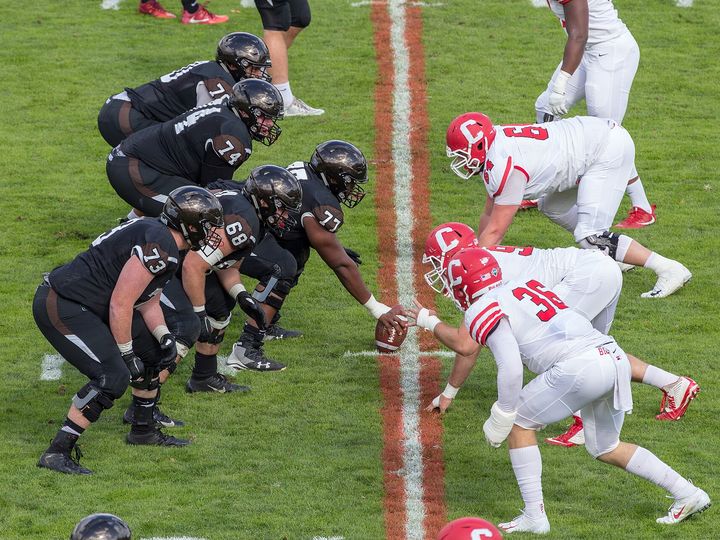
Photo: Spatms, CC BY-SA 4.0 · source file

Why cross-sport ranking fails
The breakdown happens at the level of the stat itself. Football runs head-to-head with weekly wins and losses, scoring on yards, touchdowns at four points for passes and six for runs or catches, over 13 regular-season weeks and a three-week playoff. Baseball runs 5×5 rotisserie with home runs, RBIs, runs, stolen bases and on-base percentage against wins, strikeouts, saves, ERA and WHIP. Basketball runs eight-category rotisserie: points, rebounds, assists, steals, blocks, three-pointers made and both percentage categories. The documents that govern each sport, published at lgofleagues.com/rules/, never acknowledge one another. They do not need to.
This is not a translation problem. It is a categorical impossibility. A fantasy football manager chases weekly variance; a baseball manager chases cumulative ratios across six months. The basketball manager lives in between, with daily lineups and a rotisserie finish. The skills do not transfer, the risk profiles diverge, and the concept of "replacement level" means something different in each room. Anyone attempting to build a unified player-rankings spreadsheet is constructing a fiction. The numbers will look precise. They will be meaningless.
The board, round by round
Source: the league’s own draft board, as published on this site since 2015.
The unit that does work
The roster itself provides the common currency. Our league's rules document assigns 13 slots to football, 25 to baseball and 11 to basketball. Those 49 positions are invariant. Every manager must fill them. The constraint creates a market: a slot unfilled is a sport unplayed, and a sport unplayed is points left on the table. The draft board does not ask whether a linebacker is better than a shooting guard. It asks which slot, if left empty, costs more in expected league points.
The scarcity is uneven. Baseball claims more than half the roster. Football demands early attention because its season starts first and its weekly format punishes inactive managers. Basketball's shorter season and smaller footprint push it down the priority list for most drafters. The board reflects this. The first ten rounds of our league's draft contain 53 baseball picks, 34 football picks and 51 basketball selections. Managers are not ranking players. They are securing positional coverage before the scarce positions disappear.
What each sport pays out
The scoring asymmetry resolves at season's end. Our rules convert each sport's final table into league points on a fixed scale: 14 for the champion, 1 for last place, the rest distributed between. The maximum is identical across all three sports. A perfect football season pays 14 league points. A perfect baseball season pays 14 league points. The basketball title pays the same.
This is the bridge. A manager need not know how to value a closer against a running back. She must know that each sport offers the same jackpot, that each requires a filled roster, and that the draft is the only moment when the slots for all three are available simultaneously. The decision becomes resource allocation under constraint: which sport's slots are hardest to fill later, and which carry the highest penalty for failure? The football slot is fewest in number but earliest in deadline. The baseball slot is deepest in volume. The basketball slot is narrowest in window. The board weights these pressures, not the players who will occupy them.
Reading our board back
The draft results reveal how managers actually solved the problem. The first ten rounds show football suppressed and baseball elevated: 34 NFL picks against 53 MLB, despite football's cultural dominance and earlier start. Managers were securing their baseball foundation while the player pool was deep. Basketball split the difference at 51 picks, suggesting a middle-ground strategy—neither deferred like football nor front-loaded like baseball.
The final ten rounds invert the pattern entirely. NFL selections jump to 47. MLB selections climb to 67. NBA selections fall to 21. The late board is football and baseball territory, with basketball largely settled. This is not accidental. It is the evidence of a solved coordination problem: managers filled their scarce early-season slots first, their volume-heavy middle slots second, and their narrow late-season slots only if value fell to them. The board does not contain player ratings. It contains revealed preferences about slot timing.
The discrepancy between early and late rounds—34 football picks becoming 47, 21 basketball picks having already been 51—measures the degree to which managers disagreed about the optimal sequence. Some punted football to the end and paid for it in waiver-wire chaos. Some reached for basketball early and found themselves roster-stuffed before the MLB depth emerged. The board records these errors as data.
Where keepers change the board
The slot framework gains a backward dimension through keeper rules. Our league assigns declining round values to retained players: first-year cost is draft round minus two; second-year cost is minus four more; third year, the player returns to the pool. The rules document illustrates with a player drafted in the 18th round in 2017, kept at 16th in 2018, 12th in 2019, and free in 2020.
This mathematics alters the draft board before it is built. A manager holding a 12th-round baseball keeper has already purchased a slot at below-market price. His draft capital shifts toward other sports. A manager with no keepers faces full freight on all 49 slots. The keeper-wealthy can pursue scarcity more aggressively; the keeper-poor must balance coverage across all three sports from pick one. The board does not display this information explicitly. It encodes it in the picks that do not happen—in the baseball slugger who falls two rounds further than his raw talent suggests because three managers already have his position locked at discount.
The keeper rule also compresses the viable window for each sport. A football player kept at a 10th-round value in 2024 was likely drafted in the 12th in 2023, the 14th in 2022. The board must anticipate not only this year's scarcity but next year's depreciation. A slot filled with a one-year rental carries different weight than a slot filled with a multi-year foundation. The manager who sees the board as static player rankings misses this entirely. The manager who sees it as a portfolio of slot contracts, each with its own expiration, begins to understand why the picks fall where they do.
The draft proceeds. The shortstop and the wide receiver never meet on the same axis. They do not need to. They meet instead in the 25th slot, the 14th point, the keeper round already paid or still owed.
More in Drafts
 5002Keeper Value: Why a Kept Player Costs Two RoundsWe price keepers in rounds, and the cost is easier to see once you write it as arithmetic.NFL
 −203The Supplemental Draft and What a Spot in It CostsWe hold one supplemental spot per team, and the board shows exactly what that spot is worth.14